

Heat map shows fall in coronavirus infections in Teddington
By The Editor 5th Nov 2021
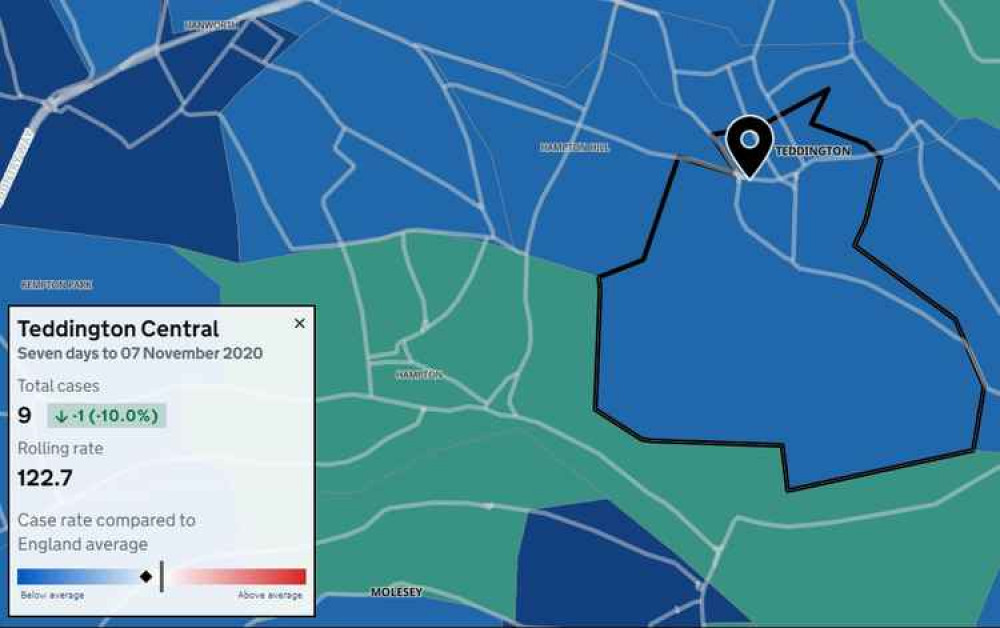


There has been a drop in the Covid-19 infection rate in a number of Teddington neighbourhoods.
The government's interactive map allows residents to see the seven-day rolling rate of new coronavirus cases broken down by Middle layer Super Output Areas (MSOAs).
These are small areas with a population of around 7,200 people living in them.
Dark purple and blue show the worst hit areas, while green and yellow highlight areas with lower rates.
These are the infection rates for Teddington neighbourhoods and the number of residents who have tested positive in the seven days to November 7.
- Teddington Central – 122.7 new cases per 100,000 people (9 cases, down from 10 last week)
- Teddington North – 152.2 cases per 100,000 people (11 cases, down from 13 last week)
- Strawberry Hill – 160.5 cases per 100,000 people (10 cases, down from 11 last week)
- Hampton Wick and Teddington East – 122.5 cases per 100,000 people (14 cases, up from 15 last week)
Download our Nub News App:
- It’s FREE and available now
- Breaking news notifications
- Your Town in Your Pocket



Share: