Richmond still has highest COVID rate in London - see where Teddington ranks
By The Editor 5th Nov 2021


Richmond is still reporting the highest rate of coronavirus infections in the capital according to new data released this morning (October 19).
In the seven days to October 12, Richmond saw a rate of 141.1 cases per 100,000 people.
The figures are based on tests carried out in laboratories (pillar one of the government's testing programme) and in the wider community (pillar two).
They are calculated by the Press Association news agency and are based on Public Health England data published on the Government's coronavirus dashboard.
Despite concerns that a large number of the borough's tests are thought to be from university students living in cities such as Durham and Manchester but still registered with a GP or home address in Richmond, the council leader has warned that residents must be "under no illusion" about the rise in cases.
Speaking in a video posted on Twitter, cllr Gareth Roberts told residents: "We know that this is a large number of cases and we are doing our best to find out if there any patterns are emerging.
"What we do know is that there are a significant number of cases which are people who have been tested away from the borough, usually in places such as Durham, Manchester or Exeter and because they have a GP address or home address here in the borough, they are being classed as Richmond cases.
"We are doing our best to ensure that we can separate those figures to give us a clear understanding of the spread of the virus here in the borough. But we must be under no illusion. These are only part of the numbers. We know that the rise of the virus is commonplace across London and here in the borough, so we need to make sure we are following all of the rules, including the new guidance."
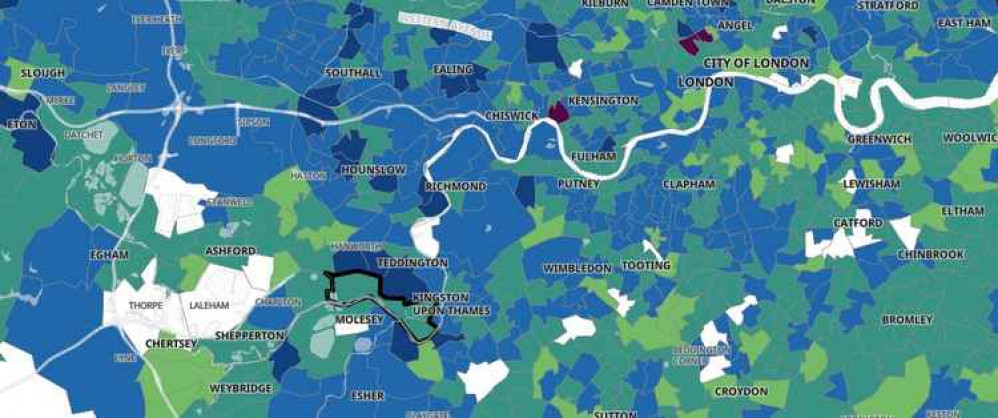
The Government's new interactive map allows residents to see the seven-day rolling rate of new cases broken down by MSOA – which stands for Middle layer Super Output Areas.
These are small areas with a population of around 7,200 people living in them.
Dark purple and blue show the worst hit areas, while green and yellow highlight areas with lower rates.
In Richmond, the MSOA with the highest rate of reported coronavirus infections was St Margaret's with 299.7 cases per 100,000 people in the seven days to October 14.
Although Richmond is reporting a generally high level of infections and it is unclear exactly how many cases are from students from outside the borough, it can still be useful to see where cases appear to be highest.
The areas with the highest coronavirus case rates in Richmond are:
St Margaret's – 299.7 cases per 100,000 people (20 cases)
Teddington Central – 272.7 cases per 100,000 people (20 cases)
Hampton Hill – 259.6 cases per 100,000 people (18 cases)
Twickenham Marble Hill – 244.9 cases per 100,000 people (18 cases)
Nursery Lands and Hampton North – 232.3 cases per 100,000 people (22 cases)
Twickenham North – 170.1 cases per 100,000 people (12 cases)
Richmond Park, Sheen Gate and Petersham – 167 cases per 100,000 people (12 cases)
Queen's Road – 166.1 cases per 100,000 people (11 cases)
Kew Gardens – 158.9 cases per 100,000 people (16 cases)
Strawberry Hill – 144.5 cases per 100,000 people (9 cases)
North Barnes – 138.3 cases per 100,000 people (14 cases)
Twickenham West – 126.3 cases per 100,000 people (14 cases)
East Sheen North – 120.8 cases per 100,000 people (11 cases)
North Sheen – 114.3 cases per 100,000 people (14 cases)
Hampton Wick and Teddington East – 113.7 (13 cases)
Heathfield – 111.2 cases per 100,000 people (12 cases)
Mortlake and South Barnes – 94.8 cases per 100,000 people (11 cases)
Twickenham Town – 87.5 cases per 100,000 people (7 cases)
Hampton Village – 87.2 cases per 100,000 people (9 cases)
Whitton – 83.9 cases per 100,000 people (7 cases)
Teddington North – 69.2 cases per 100,000 people (5 cases)
Richmond Central – 68.2 cases per 100,000 people (5 cases)
CHECK OUT OUR Jobs Section HERE!
teddington vacancies updated hourly!
Click here to see more: teddington jobs
Share:


